The rise of entrepreneurship shows no signs of slowing as Americans prepare to combat an economic downturn. In uncertain times, data shows that many workers prefer to rely on their own work ethic for job and financial security. Review these entrepreneur statistics to better understand past trends and future predictions for self-employed workers.

Whether you're thinking of starting a new business or are interested in learning the landscape of entrepreneurship, check out our statistics about the current labor market and what business owners can expect in upcoming years. In this article, we will cover:
- Our methodology
- Statistics overview
- Women entrepreneur statistics
- Entrepreneur statistics by race
- Small business statistics
- Entrepreneur success statistics
- Entrepreneur age statistics
- Entrepreneur income statistics
- Entrepreneur costs and funding statistics
- Entrepreneur education statistics
- Past entrepreneurship trends and future implications
Our methodology
All data was sourced from governmental entities, peer-reviewed journals, or relevant websites. Statistics were compared against related data by our research team and all information was reviewed by a team of editors to ensure accuracy.
Entrepreneurship statistics: Overview
Entrepreneurs can be any age, race, or gender. They may also have different backgrounds and reasons for opening a business. In this article, we'll discuss all of these factors. In the meantime, here's a quick summary of some of the top entrepreneurial statistics we'll review.
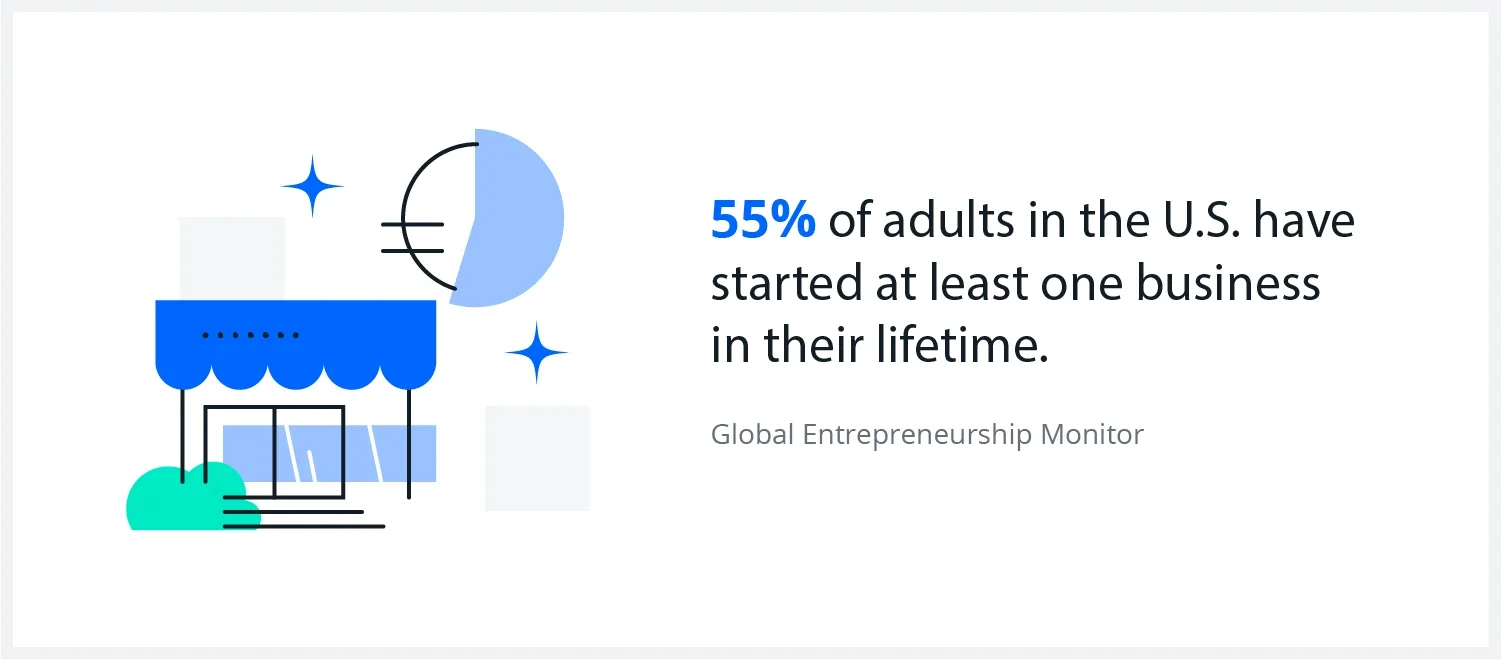
- 55% of adults in the U.S. have started at least one business in their lifetime. (Global Entrepreneurship Monitor)
- The main reasons business owners start a business are their discontent with corporate America (47.64%) and working autonomy (60.87%). (Guidant Financial)
- Motivations for starting a business include pursuing a passion (31%), an opportunity presented itself (21.36%), or because they were newly unemployed (23.44%). (Guidant Financial)
- 10% of entrepreneurs in the U.S. start a business because they're not yet ready to retire. (Guidant Financial)
- Small business owners by generation include pre-baby boomers (0.5%), baby boomers (45.5%), Generation X (46.5%), millennials (7%), and Generation Z (.5%). (Guidant Financial)
- The most commonly spoken languages among U.S. entrepreneurs are English, Spanish, French, and Chinese. (Zippia)
- The average U.S. entrepreneur can start a new business in as little as six days. However, it can take up to a year for a business to start making sales. (FinancesOnline)
Women entrepreneur statistics
There are fewer female entrepreneurs in the U.S. than males, but there has been consistent growth of women-owned businesses in the country. Still, there's plenty of room for improvement for female business owners when it comes to pay and opportunities.
- 41.5% of entrepreneurs are women, while 58.5% are men. (Zippia)
- Women start their own businesses because they feel ready to work for themselves (57.89%), are unhappy with corporate America (37.72%), and are ready to chase their passion (29.82%). (Guidant Financial)
- 1.25 million of the 3 million businesses in Texas are women-owned, as of 2022. (Office of the Texas Governor)
- On average, female entrepreneurs earn 91 cents for every dollar a man earns. (Zippia)
- 7% of women are more likely to seize an opportunity than the typical business owner. (Guidant Financial)
- A majority of women (73.68%) who own a business report feeling somewhat or very happy. (Guidant Financial)
- Among Black, Asian, Hispanic, and white entrepreneurs, women tend to become business owners at a younger age than their male counterparts. (Zippia)
- As of 2022, more women will obtain hundreds of millions of dollars in federal procurement options across 92% of federal small business contract spending. (U.S. Small Business Administration)
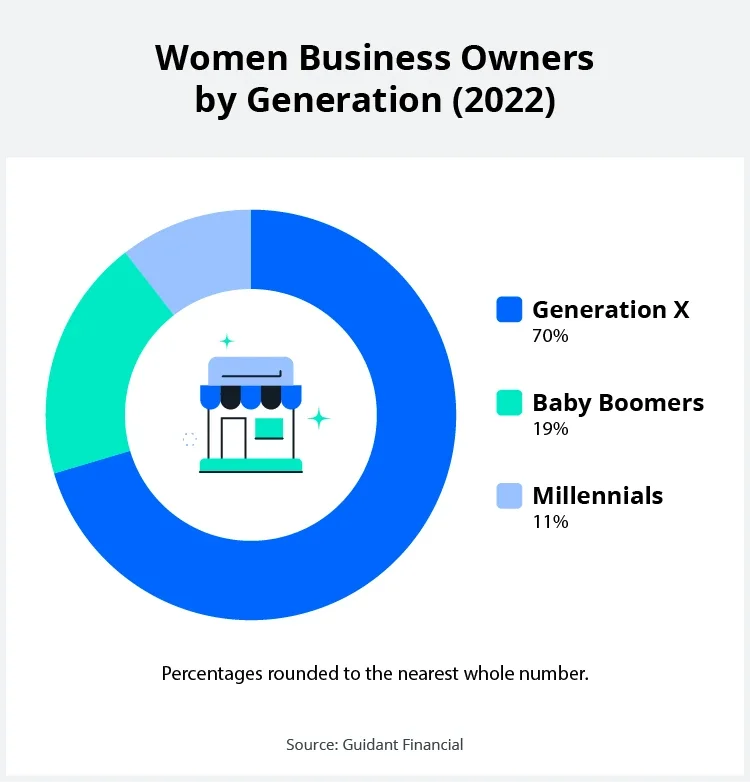
- 68.93% of women business owners were Generation X, 19.42% were baby boomers, and 10.68% were millennials. (Guidant Financial)
- 49% of women-owned businesses are 0–5 years old, 17.5% are 6–10 years old, 12.28% are 11–15 years old, 5.26% are 16–20 years old, and 6.14% are 20 years old or more. (Guidant Financial)
- As of 2022, women were slightly more likely than other entrepreneurs (23.68%) to own a 10-years-or-older business. (Guidant Financial)
Entrepreneurship statistics by race
Historically, white business owners have accounted for the majority of entrepreneurs in the United States. This is still true with more than 70% of self-employed individuals identifying as Caucasian. However, there has been more opportunity for BIPOC entrepreneurs in recent years than ever before.
- There are now more than 4 million minority-owned companies in the United States, with annual sales totaling close to $700 billion. (U.S. Senate Committee)
- Entrepreneurs of color started businesses because they were motivated to become their own boss (57.58%), dissatisfied with corporate America (45.45%), and wanted to chase their passion (33.33%). (Guidant Financial)
- Entrepreneurs of color (67.67%) identified a combined happiness level of somewhat or very happy. (Guidant Financial)
- In the last 10 years, minority business enterprises accounted for more than 50% of the two million new businesses started in the United States, and created 4.7 million jobs. (U.S. Senate Committee)
- The top three business priorities among entrepreneurs of color were increasing staff (49.49%), growing or remodeling their business (46.46%), and investing in digital marketing (39.39%). (Guidant Financial)
- A small business report found its respondents of color included business owners identifying as Asian or Asian American (24.35%); Black or African American (21.74%); Hispanic, Latino, or Spanish Origin (21.74%); Indigenous American (6.96%); Middle Eastern or North African (7.83%); Native Hawaiian or Pacific Islander (3.48%). (Guidant Financial)
- 62% of entrepreneurs of color owned independent businesses as opposed to franchises. (Guidant Financial)
- Entrepreneurs of color were more likely to have started their businesses from scratch (35.48%), compared to the 27.22% average. (Guidant Financial)
- 26.88% of entrepreneurs of color bought an existing business compared to 31.76% on average. (Guidant Financial)
- According to an annual business survey with data from 2018, minority-owned businesses totaled 1,048,323. (United States Census Bureau)
- Franchisees of color were more likely to purchase a new franchise location (30.11%) than purchase an existing location (13.98%). (Guidant Financial)
- Retail (storefront, e-commerce) was the most popular industry for BIPOC entrepreneurs at 17.35%. (Guidant Financial)
- The second and third most popular industries for BIPOC entrepreneurs were food, restaurant, and business services, tied at 11.22%. (Guidant Financial)
- Other industries including health, beauty, and fitness services (9.18%), residential and commercial services (9.18%), and care services (7.14%) were noted among entrepreneurs of color. (Guidant Financial)
Small businesses are the backbone of the American economy, contributing by selling goods and services and employing people in their communities. Nearly 100 percent of U.S. businesses are classified as small businesses, and there has been a steady upward trend in business formation applications in recent years.
- In 2022, baby boomers and Gen X made up 92% of all entrepreneurs. (Guidant Financial)
- 39% of small business owners report being “very happy" with their career, while only 4.5% report being “very unhappy." (Guidant Financial)
- 99.9% of all businesses in the U.S. are small businesses. (U.S. Small Business Administration)
- 47.7% of entrepreneurs say their motivation for starting a business was because they wanted to be their own boss. (Guidant Financial)
- The most common industry for entrepreneurs to start businesses in is retail. (Guidant Financial)
- 410, 348 new business formation applications were filed during the month of June 2022. (U.S. Census Bureau)
- To improve small business employee retention and recruitment, business owners have overwhelmingly (63.17%) increased compensation. (Guidant Financial)
- America's more than 32 million small businesses and innovative startups are driving the nation's recovery in their role as job creators and community economic anchors. (U.S. Small Business Administration)
- 31% of entrepreneurs started a business to pursue their passion. (Guidant Financial)
- 46.1 % of entrepreneurs started a business because they were laid off or weren't ready to retire.
- 54.55% of small business owners reported that communication skills are critical for their employees. (Guidant Financial)
- 46.56% of small business owners reported that teamwork skills are critical for their employees. (Guidant Financial)
- 38.36% of small business owners reported that sales and customer relationship management skills are critical for their employees. (Guidant Financial)
- 36.36% of small business owners reported that critical thinking and problem-solving skills are critical for their employees. (Guidant Financial)
- The number of small businesses in need of new workers has increased by 40% at the end of March 2022. (U.S. Small Business Administration)
- 60.9% of entrepreneurs say they opened their own business because they were dissatisfied with corporate America. (Guidant Financial)
Success rate statistics
According to the BLS, less than 20 percent of businesses will fail in their first year. However, by year six, this number increases to more than 50%. But that's not to say there aren't plenty of opportunities for success among startups.
- The startup's early survival rate was 81.7% in 2021, reflecting an increase from 78.4% in 2020 as the economy improved. (Kauffman Indicators of Entrepreneurship)
- 81.7% of startup firms survive one year after being founded. (Kauffman Indicators of Entrepreneurship)
- Those that start a business that closely aligns with their previous experience are significantly more likely to achieve high growth (in some cases up to 125% more likely). (National Bureau of Economic Research)
- New business owners in their 20s are least likely to achieve a successful exit or create a business in the top 0.1% of growth. (National Bureau of Economic Research)
- In March 2022, around 18,369 new home services businesses opened in the United States. (Statista)
- 65% of business owners reported being profitable in 2022. (Guidant Financial)
- On starting a firm, a 50-year-old founder is 1.8 times more likely to achieve upper-tail growth than a 30-year-old founder. (National Bureau of Economic Research)
Entrepreneur age statistics
Anyone can be an entrepreneur, and there are even elementary-age children who have started businesses in the U.S. However, most entrepreneurs get their start and find success in their 40s.
- The average entrepreneur is over 40 years old. (Zippia)
- The average entrepreneur in the U.S. starts a business at 42, but that age varies by industry. In the software industry, the average age is 40, while the oil and gas industry has entrepreneurs closer to 48. (National Bureau of Economic Research)
- The average age of founders of high-performing startups (in the top 0.1% of growth in the first five years) in the U.S. is 45. (National Bureau of Economic Research)
Entrepreneur income statistics
An entrepreneur's income can vary dramatically depending on their industry, education, experience, and location.
- On average, an entrepreneur with a doctorate degree will earn 35% more than an entrepreneur with a high school diploma. (Zippia)
- Entrepreneurs in NY, CT, and D.C. tend to have the highest average salary. (Zippia)
- Entrepreneurs in HI, MS, and AR tend to have the lowest average salary. (Zippia)
- Entrepreneur salaries typically range from $48K–$130K per year. (Indeed)
Entrepreneur costs and funding statistics
While many entrepreneurs have been able to start an online business with no money down, in most cases, new business owners will need to find a way to pay for their startup and operating expenses.
Entrepreneurs manage a range of responsibilities to jump-start their dream businesses. A top priority is managing funds to kick-start small businesses.
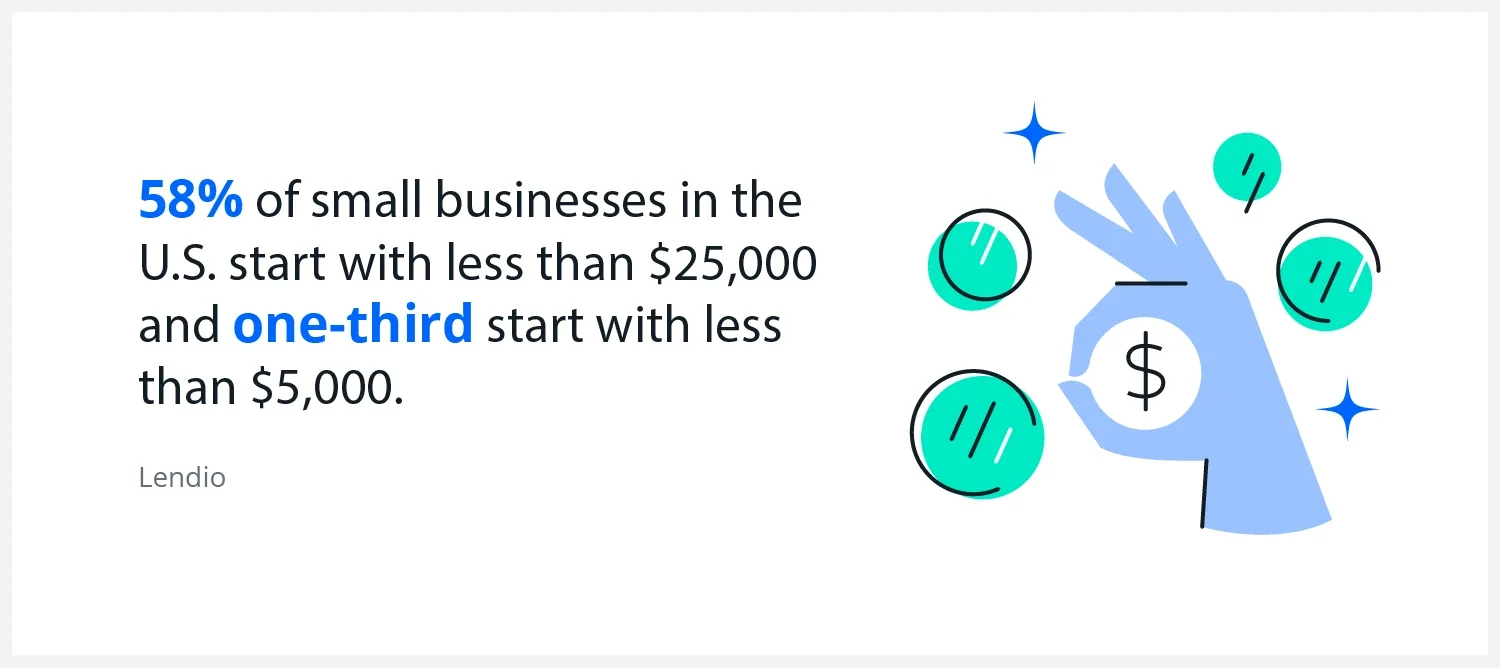
- 33% of small businesses start with less than $5K in startup funds. (Lendio)
- As of July 2022, a small business federal contracting goal awarded 27.2% or $154.2 billion in federal contract dollars to small businesses, an $8 billion increase from the previous fiscal year. (U.S. Small Business Administration)
- Entrepreneurs with mobile businesses spend an average of $92,500 to get started. (Business.org)
- Entrepreneurs with brick-and-mortar stores spend an average of $100K to start their businesses. (Business.org)
- Inventory and equipment make up 51% of business expenses during their first year of operation. (Business.org)
- The California Dream Fund is a one-time $35 million grant program to seed entrepreneurship and small business creation in the state of California in 2022. (CA.gov)
- 66% of entrepreneurs used their own money to start their businesses. (Zippia)
- 50% of business owners underestimate how much they'll need to spend in their first year of business. (Business.org)
- 1 in 4 entrepreneurs accepted a business loan from a friend or family member to start their company. (Lendio)
Entrepreneur education statistics
In some cases, you don't need a degree to start a business. Still, 87% of entrepreneurs have at least an associate's degree with many earning higher degrees as well. Gaining more education also tends to raise the base salary of business owners. Here are the latest entrepreneur education statistics from Zippia.
- 11% of entrepreneurs have a master's degree.
- 62% of entrepreneurs have a bachelor's degree.
- 14% of entrepreneurs have an associate's degree.
- 6% of entrepreneurs have a high school diploma.
- 7% of entrepreneurs have another type of degree.
Previous entrepreneur trends
Let's take a look at some trends we've seen over the past few years and how their impact will influence business owners in the future.
The Great Resignation
In 2021, there was a mass wave of resignations due to the high demand for workers and a lower unemployment rate. The new trend was ushered in due to changes in the labor market when businesses started to reopen following the COVID-19 pandemic.
- As of November 2022, 4.2 million Americans left their jobs—bringing the year's total to 46.6 million. (Statista)
- 1 in 4 employees don't feel secure in their current job, and nearly half of them intend to look for employment alternatives in 2023. (Computerworld)
- 42% of people who quit a job where they earn $150K or more each year do so to start their own business. (Digital)
- 27% of people who quit a job where they earn $50K or less annually leave to start a business. (Digital)
- The top three methods small business owners use to fight the Great Resignation are expanding recruitment advertising efforts (22.93%), increasing benefits (17.80%), and handing out hiring bonuses (16.34%). (Guidant Financial)
Effects of the pandemic
COVID-19 cases started to dwindle in spring 2022. Aside from spikes in summer and around the winter holidays, things have continued to improve. Still, the pandemic's lasting impact continues to affect business owners.
- The BLS predicts that there will be more than 10 million self-employed workers by the year 2026. (U.S. Bureau of Labor Statistics)
- In 2022, there was a 6.3% decrease in small business applications compared to the previous year. However, there were still more applications than there were from 2015–2020. (Commerce Institute)
- 59% of surveyed workers say they became interested in starting their own business during the pandemic because they realized they were vulnerable to job loss while working for someone else. (Digital)
- In an online survey conducted in 2022, 51.9% of surveyed small businesses in the U.S. said they received financial assistance from the Paycheck Protection Program (PPP) to combat the effects of the COVID-19 pandemic since late December 2020. (Statista)
Start your own business
Entrepreneurship has gradually become a preferred career path for adults ranging from energetic 20-year-olds to more experienced individuals nearing retirement age. No matter your age, if you're ready to open your own business and be your own boss, we want to help.
If you need assistance starting your business, LegalZoom can help you register your new company, stay compliant with local and federal regulations, and prepare you to grow your business.


